Benchmark w wykonaniu standardowego alokatora pamięci – libc
cubes                   time:   [334.82 ms 337.41 ms 340.40 ms]
Found 2 outliers among 100 measurements (2.00%)
  1 (1.00%) high mild
  1 (1.00%) high severe

bincode                 time:   [220.54 ns 220.95 ns 221.42 ns]
Found 9 outliers among 100 measurements (9.00%)
  4 (4.00%) low mild
  1 (1.00%) high mild
  4 (4.00%) high severe

json                    time:   [610.49 ns 613.89 ns 617.50 ns]
Found 10 outliers among 100 measurements (10.00%)
  6 (6.00%) low mild
  1 (1.00%) high mild
  3 (3.00%) high severe

flat                    time:   [442.13 ns 443.78 ns 445.65 ns]
Found 9 outliers among 100 measurements (9.00%)
  3 (3.00%) high mild
  6 (6.00%) high severe

foramt!                 time:   [87.691 ns 88.212 ns 88.730 ns]
Found 10 outliers among 100 measurements (10.00%)
  7 (7.00%) low mild
  3 (3.00%) high mild

string concat           time:   [246.98 ns 248.03 ns 249.45 ns]
Found 5 outliers among 100 measurements (5.00%)
  2 (2.00%) high mild
  3 (3.00%) high severe
Benchmark w wykonaniu tcmalloc
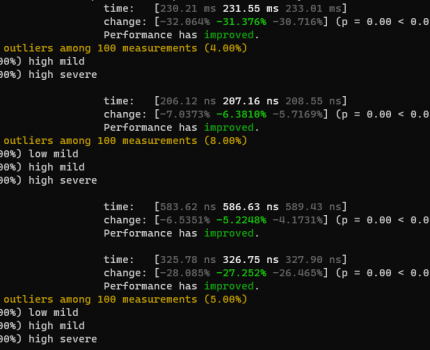
cubes                   time:   [230.21 ms 231.55 ms 233.01 ms]
                        change: [-32.064% -31.376% -30.716%] (p = 0.00 < 0.05)
                        Performance has improved.
Found 4 outliers among 100 measurements (4.00%)
  3 (3.00%) high mild
  1 (1.00%) high severe

bincode                 time:   [206.12 ns 207.16 ns 208.55 ns]
                        change: [-7.0373% -6.3810% -5.7169%] (p = 0.00 < 0.05)
                        Performance has improved.
Found 8 outliers among 100 measurements (8.00%)
  4 (4.00%) low mild
  2 (2.00%) high mild
  2 (2.00%) high severe

json                    time:   [583.62 ns 586.63 ns 589.43 ns]
                        change: [-6.5351% -5.2248% -4.1731%] (p = 0.00 < 0.05)
                        Performance has improved.

flat                    time:   [325.78 ns 326.75 ns 327.90 ns]
                        change: [-28.085% -27.252% -26.465%] (p = 0.00 < 0.05)
                        Performance has improved.
Found 5 outliers among 100 measurements (5.00%)
  1 (1.00%) low mild
  3 (3.00%) high mild
  1 (1.00%) high severe

foramt!                 time:   [78.699 ns 79.170 ns 79.605 ns]
                        change: [-10.647% -9.7988% -9.0033%] (p = 0.00 < 0.05)
                        Performance has improved.
Found 4 outliers among 100 measurements (4.00%)
  2 (2.00%) low mild
  2 (2.00%) high mild

string concat           time:   [151.90 ns 153.10 ns 154.56 ns]
                        change: [-38.799% -38.223% -37.440%] (p = 0.00 < 0.05)
                        Performance has improved.
Found 9 outliers among 100 measurements (9.00%)
  3 (3.00%) high mild
  6 (6.00%) high severe
Jak widać wzrost wydajności w przypadku dużej ilości alokowanych obiektów sięga nawet 30%, w przypadku łączenia stringu oraz konwersji z u32 na string przyspieszenie wynosi blisko 40%
A jak wygląda zużycie pamięci, na pierwszy ogień idzie libc:
==20425== HEAP SUMMARY:
==20425==     in use at exit: 0 bytes in 0 blocks
==20425==   total heap usage: 18,922 allocs, 18,922 frees, 98,509,637 bytes allocated
==20425==
==20425== All heap blocks were freed -- no leaks are possible
a teraz tcmalloc:
==20998== HEAP SUMMARY:
==20998==     in use at exit: 3,456 bytes in 36 blocks
==20998==   total heap usage: 18,930 allocs, 18,894 frees, 98,584,004 bytes allocated
==20998==
==20998== LEAK SUMMARY:
==20998==    definitely lost: 0 bytes in 0 blocks
==20998==    indirectly lost: 0 bytes in 0 blocks
==20998==      possibly lost: 1,344 bytes in 4 blocks
==20998==    still reachable: 2,112 bytes in 32 blocks
==20998==         suppressed: 0 bytes in 0 blocks
==20998== Rerun with --leak-check=full to see details of leaked memory
Jak widać tcmalloc alokuje więcej pamięci oraz inaczej wygląda usuwanie obiektów co w przypadku testu wygląda jak niewielki wyciek pamięci, natomiast długo trwałe działanie aplikacji pokazuje stabilne zużycie pamięci
Aby cieszyć się tcmalloc wystarczy dodać do Cargo.toml
tcmalloc = "0.3.0"oraz w main.rs lub lib.rs
extern crate tcmalloc;
use tcmalloc::TCMalloc;
#[global_allocator]
static GLOBAL: TCMalloc = TCMalloc;
